Product Features
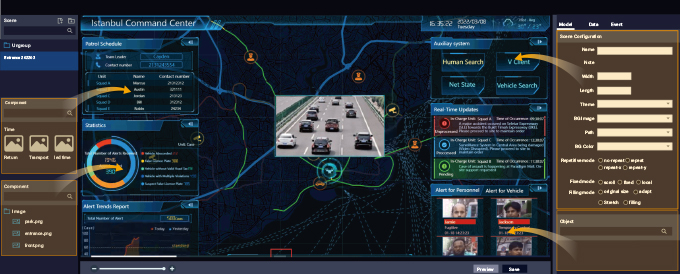
The visualization dashboard platform is a set of custom software. It present complex data through graphical or image display, providing customers with an intuitive, interactive visualization environment.
1. Support heterotypic ultra high resolution display: total pixels ≤ 66,355,200 (up to 8*4K resolution, horizontal pixels ≤ 15,360, vertical pixels ≤ 8640;
2. Support Scene Editor: zero programming, drag-and-drop editing, real-time scene layout and interacting logic deployment;
3. Support Interactive control: separated display and control design, diaplay screen display corresponding information after interactive operation on control terminal;
4. Modular Display element components: built-in ≥ 50 common components such as charts, labels, indicators, containers, and interactive components, which can be used multiple times after design;
5. Data Interoperability:supports the access of relational database, Hadoop,ES,Kafka,Redis,API data source, Excel and other data.
Visual Platform Editor Preview


플랫폼 기본 구성
[ 정보 수집을 통한 최선의 결정 도출 ] |
|||
|---|---|---|---|
| 신용정보 | 기업 및 개인에 대한 신용 정보 | 순찰 데이터 수집 | 모바일 앱을 통한 종합정보 컨트롤 |
| 환경 모니터 | 하천 관리 규정 | 치안 유지 | 영상보안 |
| 대기상태 모니터 | 환경보호 감시데이터 | 전력량 통계 | 정밀관리 |
| 안전 | 기업리스트 사전예방을 위한 데이터 수집 | 관심 지역 세분화 | 소규모 상점 등에 대한 위험 요소 감지 |
시스템 운영 방안
[ 정보수집 관리방안 수립 ] |
||
|---|---|---|
| 정밀관리 | ▶ ▶ ▶ | 통합관리 |
| 이벤트 처리 | ||
| 세분화 | 순찰강화 | |
| 정보수집 | ||
| 정보결합 | GIS 기반 관리 | |
| 법 집행 연계 | ||
| 빅데이터 | 정보 분석 고도화 | |
| 빅데이터 관리 | ||
정밀 관리 방식
[특정 기준에 따라 도시를 그리드 방식으로 세분화시키고 각 단위 별로 정밀하게 데이터 수집, 이벤트 보고 등을 통해서 |
|||
|---|---|---|---|
|
이벤트로 추세 예측 |
|
정보 수집 처리 |
|
시스템 순찰처리 |
|
그리드 관리 |
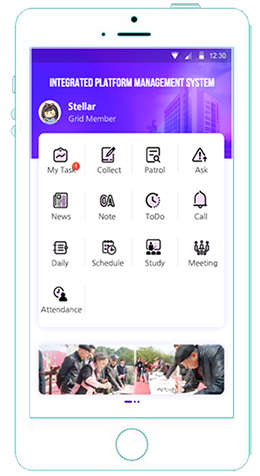
모바일 앱
[모바일 앱을 통해 통합 시스템을 관리 활용 가능합니다. ] |
|
|---|---|
|
|


